Demand Curve:
--------------
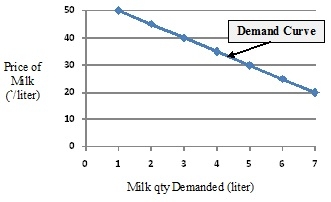
The demand schedule can be converted into a demand curve by measuring price on vertical axis (Y) and quantity on horizontal axis (X) as shown in the figure below.

Fig. 1: Demand Curve of consumer “A”
----------------------------------
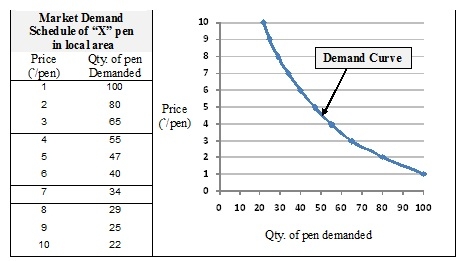
A demand curve shows the relationship between the price of a product and the quantity demanded over a period of time. The curve slopes downwards from left to right showing that, when price rises, less is demanded and vice versa. Thus the demand curve represents the inverse relationship between the price and quantity demanded, other things remaining constant.
The demand curve is normally drawn in textbooks as a straight line suggesting a linear relationship between price and demand but in reality, the demand curve will be non-linear! No business has a perfect idea of what the demand curve for a particular product looks like, they use real-time evidence from markets to estimate the demand conditions and this accumulated experience of market conditions gives them an advantage in constructing demand-price relationships.


